I’m presenting at the Toronto SAS Meetup on 05Mar2019, but I won’t be there!

Loading

I’m presenting at the Toronto SAS Meetup on 27Feb2019 05Mar2019, but I won’t be there, because, technology permitting, I’ll be presenting remotely from my nice warm office in the UK. This is intended to take advantage of remote communications and to avoid the need for me to fly over the Atlantic for a 20-minute talk!

More information, including registration details, can be found at the Toronto SAS Meetup site.

Toronto SAS Meetup
I’ll be presenting “Converting Plots from SAS/GRAPH to ODS Graphics”. Please come to the meeting and ask me questions, as I’ll be happy to discuss any of the points in my presentation with you.

If you enjoy this presentation, then talk to Mamadou Dakouo about inviting me to present again at a future meeting, as this is the first of 4 different presentations about ODS Graphics.

The winner of the Book Draw at the SUGUKI April18 meeting in London is … Chris Smith!

Loading

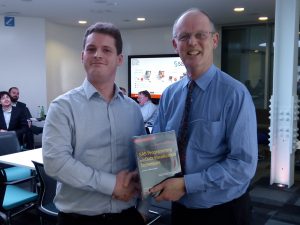
The winner of the Book Draw at the SUGUKI April18 meeting in London was Chris Smith!

The meeting in SAS UK’s London offices was a great success. Hadley Christoffels presented on data management in the cloud after I’d presented my “Converting Plots from SAS/GRAPH to ODS Graphics” paper to a lively and appreciative audience.

A SUGUKI meeting in Edinburgh will be held on 19 April, before we return to SAS UK’s offices in London for the May meeting on 3 May. I’ll be presenting again at the July meeting, but you can find all the details about the SUGUKI meetings on their web site.

Poll: How does your company create graphs?

Loading

ODS Graphics has been around since SAS 9.1.3 (in 2006!), and yet it hasn’t yet taken over the SAS graphics world, even though it could create the vast majority of graphs.

With this in mind I thought I’d create a quick poll to see what is currently being used out there in the real world:

How does your company create graphs?

View Results

Loading ... Loading ...

If you think your company ought to be using ODS Graphics more, then download our SAS training course list for free.

If you would like to learn about ODS Graphics yourself, even if your company doesn’t want to pay for a training course for you and your colleagues, then you should read “Part III: Data Visualization” (chapters 9-14) in my book “SAS Programming and Data Visualization Techniques: A Power User’s Guide” instead.

I’ve updated my app about Graphs again

Loading

I would certainly recommend installing my Graphs app sooner, rather than later, as the next time I add a new question the price will have to be increased. It can be installed now from Google Play, Amazon Appstore and Chrome Web Store, depending on your preferred platform.

“Graphs: How Do You Do This in SAS?” looks at generating graphs using classic SAS/GRAPH and the new ODS Graphics. I’ve added a question that looks at how an information box (graph inset) can be added to line graphs in ODS Graphics, as compared to using Annotate in SAS/GRAPH.

The latest versions of all the apps can be found here.