![]()
If you use Windows 11, and it has been updated to 22H2, then you can run Android apps from Amazon Appstore or side-load them as APK files.
- Install “Amazon Appstore” from the Microsoft Store on your Windows 11 PC. This will give you access to Android apps in the Amazon Appstore, but will also install the Windows Subsystem for Android (WSA). If you cannot find this software there, then you may still need to update Windows 11 to 22H2.
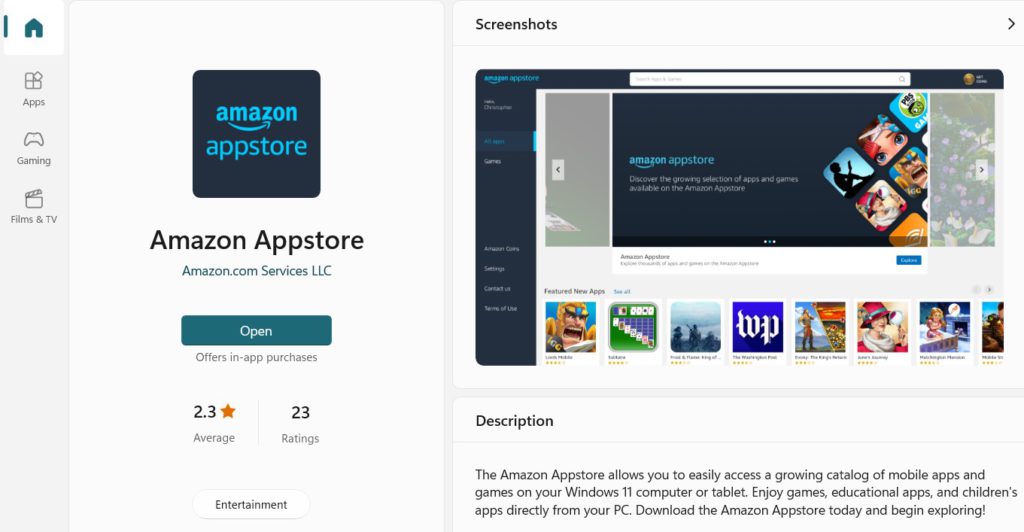
- There is at least one Holland Numerics app that can be installed directly from the Amazon Appstore, “How Do You Do This in SAS?“, which is free and will give you a taste of what the other Android apps will look like on Windows 11.
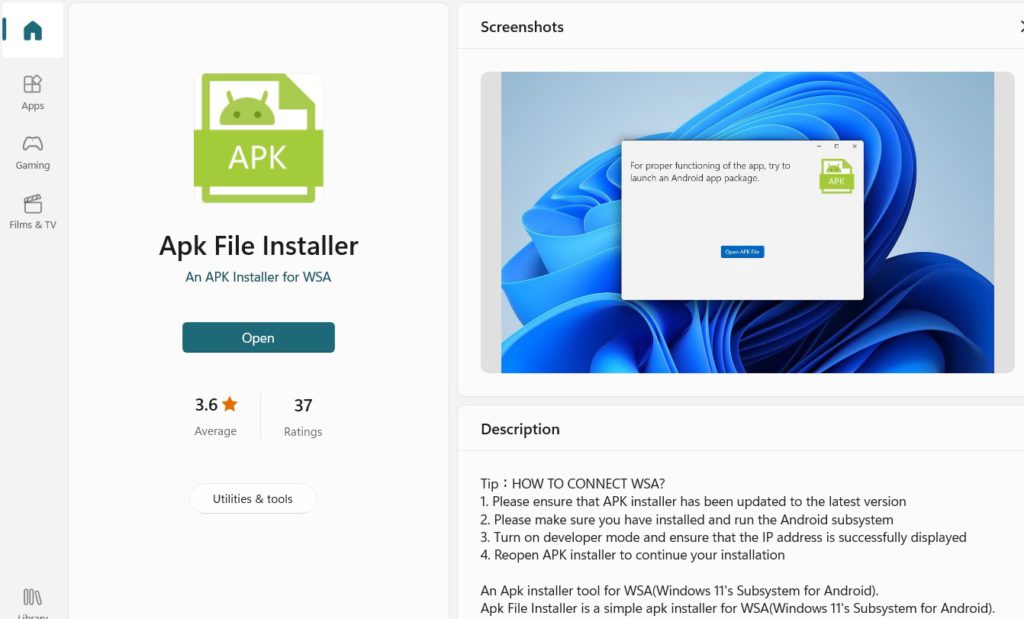
- If you want to install Android apps from APK files, then you will need to install another app from the Microsoft Store. I have tested a few of the free APK installers, and am currently using “Apk File Installer“.
- If you would like to install some of my apps directly from APK files on Windows 11, then they can be downloaded from the Windows 10/11 Store (which includes prices), and select one of the apps with “(Android app)” in their name, They are downloaded as Zip files, which must be unzipped before installing with the APK installer, including:
- SAS course apps
- How Do I Do This in SAS? apps
- Brain training apps
- Puzzles and games apps
- Additional email setup may be needed in Windows 11 for the “SAS course” and “How Do I Do This in SAS?” apps, as they use “mailto:” links, which must be associated with an email client.
