SAS ODS Graphics
Products and papers relating to SAS ODS Graphics
Showing 1–16 of 28 resultsSorted by popularity
-
Something for Nothing! Converting Plots from SAS/GRAPH to ODS Graphics
£0.00- SAS Global Forum, National Harbor, MD, USA – 24th March 2014
- SAS Professionals Convention, Marlow, UK – 26th June 2014
- PhUSE Single Day Event, Brussels, Belgium – 18th September 2014
- PhUSE, London, UK – 13th October 2014
- Amgen SAS Tech Talk, Cambridge, UK – 11th November 2014
- PhUSE Single Day Event, Utrecht, Netherlands – 4th February 2016
- SUGUKI, London.UK – 5th April 2018
- Toronto SAS Meetup, Toronto, Canada (remote) – 5th March 2019
-

Converting Annotate to ODS Graphics. Is It Possible?
£0.00- SAS Global Forum, Dallas, TX, USA – 27th April 2015
- SUGUKI, London, UK – 4th October 2018
-

Creating Graph Collections with Consistent Colours Using ODS Graphics?
£0.00- SAS Global Forum, San Francisco, CA, USA – 1st May 2013
- PhUSE, London, UK – 14th October 2014
-

GTL (Graphics Template Language) in SAS 9.2
£0.00- PhUSE, Manchester, UK – 13th October 2008
- SAS Global Forum, National Harbor, MD, USA – 24th March 2009
- PhUSE Single Day Event, Brussels, Belgium – 2nd April 2009
- PhUSE Single Day Event, Frankfurt, Germany – 6th May 2009
- PhUSE, Budapest, Hungary – 12th October 2012
-

Why Should You Be Using SG (Statistical Graphics) Procedures in SAS 9.2?
£0.00- SAS Global Forum, Las Vegas, NV, USA – 7th April 2011
- PhUSE, Brighton, UK – 12th October 2011
- PhUSE Single Day Event, Beerse, Belgium – 8th May 2012
- PhUSE Single Day Event, Welwyn Garden City, UK – 26th June 2012
- SAS Professionals Convention, Marlow, UK – 11th July 2012
- PhUSE Single Day Event, Frankfurt, Germany – 17th April 2013
- PhUSE Single Day Event, Basel, Switzerland – 28th June 2013
-

Developing ODS Templates for Non-Standard Graphs in SAS 9.2
£0.00- SAS Global Forum, Seattle, WA, USA – 12th April 2010
- PhUSE, Berlin, Germany – 20th October 2010 (Best Presentation in Coding Solutions)
- PhUSE Single Day Event, Brussels, Belgium – 28th April 2011
- PhUSE Single Day Event, Frankfurt, Germany – 4th May 2011
- PhUSE Single Day Event, Uxbridge, UK – 6th June 2011
-

Using SAS Studio Tasks to Plot with ODS Graphics
£0.00- SAS Global Forum, Las Vegas, NV, USA – 22nd April 2016
- SAS Forum UK, Birmingham, UK – 27th September 2016
- SUGUKI, London, UK – 10th January 2019
-

Using the ODS Graphics Designer to Create Your Own Templates in SAS 9.2
£0.00- PhUSE, Basel, Switzerland – 20th October 2009
- PhUSE Single Day Event, Copenhagen, Denmark – 15th March 2010
- SAS Global Forum, Seattle, WA, USA – 12th April 2010
- PhUSE Single Day Event, Welwyn Garden City, UK – 11th May 2010
-

Standard Graph Templates
£0.00- PhUSE, Lisbon, Portugal – 8th October 2007
- SAS Global Forum, San Antonio, TX, USA – 16th March 2008
-

Making Graphs Easier to Validate – The Benefits of ODS Graphics
£0.00- SAS Global Forum, Orlando, FL, USA – 5th April 2017
-

Using Just SAS 9.1 to Draw Trellis Graphs
£0.00- PhUSE, Dublin, Eire – 10th October 2006
- Wisconsin Illinois SAS Users Conference, Milwaukee, WI, USA – 22nd June 2007
-
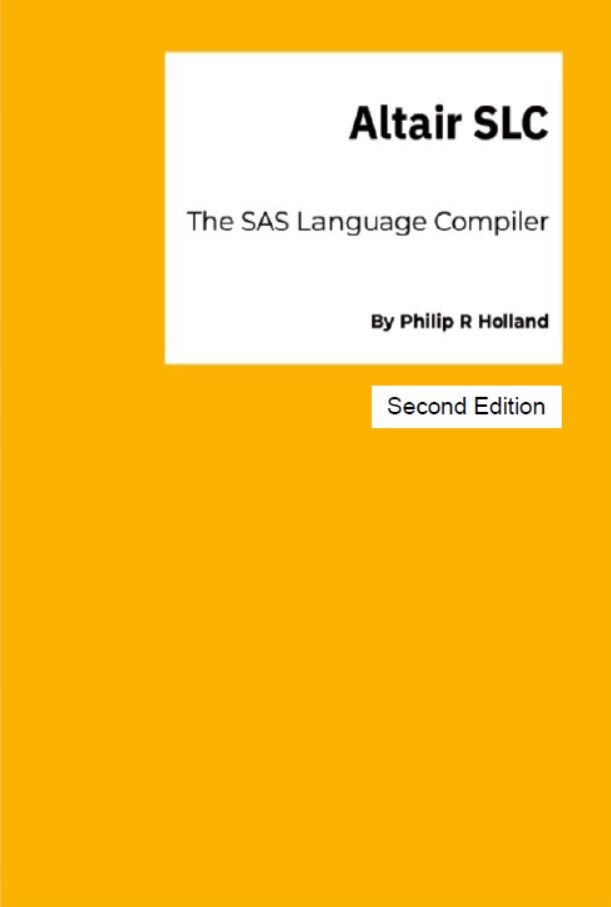
Altair SLC: The SAS Language Compiler (PDF) – Second Edition
£5.00The book concentrates on Altair SLC, looking at the pros and cons of using Altair SLC to develop SAS programs. Code samples are provided throughout this book, so you can learn more about Altair SLC and SAS programming by following these examples.
Topics included:
- What is Altair SLC?
- Introduction to Altair Analytics Workbench
- Altair SLC for Clinical Trials
- Generating Graphics with Altair SLC
- Using Altair SLC with R and Python
Note: these chapters are included in SAS Programming Experiences: A How-To Guide from a Power SAS User, so, if you have already purchased this book, then you already have these chapters!
-
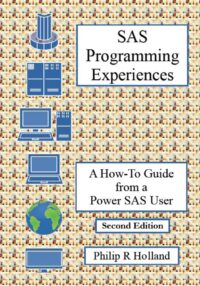
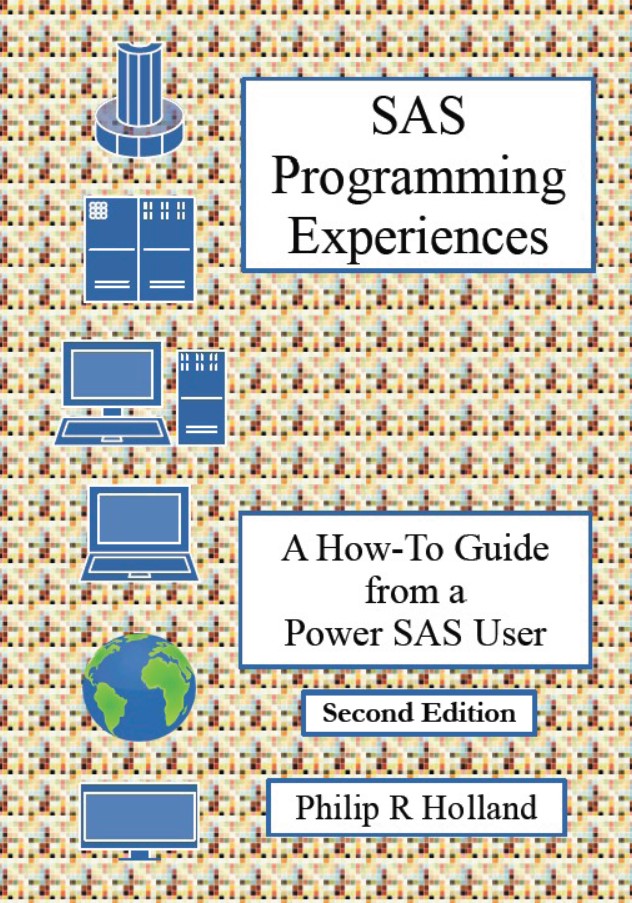
SAS Programming Experiences: A How-To Guide from a Power SAS User (PDF) – Second Edition
£7.00This PDF ebook is divided into 3 sections:
- SAS Programming Methods, where I discuss ways to get the most value from your SAS licence fees.
- SAS Interfaces for Programming, where I look at how installing and editing programs using SAS software has changed.
- SAS Programming Alternatives, where I look at the pros and cons of using Altair SLC to develop SAS programs.
Code samples are provided throughout this book, so you can learn more about SAS programming by following these examples.
Topics included:
- SAS Programming Methods
- The Art of Defensive Programming: Coping with Unseen Data
- Writing Reusable Macros
- SAS Hints and Tips
- Using SAS Software for Hobbies
- SAS Interfaces for Programming
- The History of SAS Editors and Installs
- The History of SAS Enterprise Guide and SAS Studio
- Using SAS Studio Tasks to Plot with ODS Graphics
- Making Graphs Easier to Validate using ODS Graphics
- SAS Alternatives
- What is Altair SLC?
- Introduction to Altair Analytics Workbench
- Altair SLC for Clinical Trials
- Generating Graphics with Altair SLC
- Using Altair SLC with R and Python
-

Practical ODS Graphics course notes (PDF)
£20.00This PDF ebook is a copy of the course notes used with the Practical ODS Graphics course listed in the list of Training Courses provided by Holland Numerics Ltd. All code included in the PDF ebook can be copied and pasted into SAS to try it out yourself.
-

ODS Graph Templates course notes (PDF)
£20.00This PDF ebook is a copy of the course notes used with the ODS Graph Templates course listed in the list of Training Courses provided by Holland Numerics Ltd. All code included in the PDF ebook can be copied and pasted into SAS to try it out yourself.
-
Sale!

SAS Programming Experiences: A How-To Guide from a Power SAS User (paperback) – Second Edition
Original price was: £36.50.£25.55Current price is: £25.55.This book is divided into 3 sections:
- SAS Programming Methods, where I discuss ways to get the most value from your SAS licence fees.
- SAS Interfaces for Programming, where I look at how installing and editing programs using SAS software has changed.
- SAS Programming Alternatives, where I look at the pros and cons of using Altair SLC to develop SAS programs.
Code samples are provided throughout this book, so you can learn more about SAS programming by following these examples.
Topics included:
- SAS Programming Methods
- The Art of Defensive Programming: Coping with Unseen Data
- Writing Reusable Macros
- SAS Hints and Tips
- Using SAS Software for Hobbies
- SAS Interfaces for Programming
- The History of SAS Editors and Installs
- The History of SAS Enterprise Guide and SAS Studio
- Using SAS Studio Tasks to Plot with ODS Graphics
- Making Graphs Easier to Validate using ODS Graphics
- SAS Alternatives
- What is Altair SLC?
- Introduction to Altair Analytics Workbench
- Altair SLC for Clinical Trials
- Generating Graphics with Altair SLC
- Using Altair SLC with R and Python

ISBN: 978-1-326-75545-4
