SAS ODS Graphics

  • Graphs: How Do You Do This in SAS? (Android app)

    £2.00

    This app, “Graphs: How Do You Do This In SAS?”, is one of a series of eBooks about SAS software programming focusing on frequently asked questions and answers about classic SAS/GRAPH and the new ODS Graphics, illustrated by code samples which can be sent by email directly from the app. The series of ebooks has been designed to encourage users to contribute questions some of which will be included in future versions of the app.

    Graphs: How Do You Do This in SAS? (Android app)

    £2.00

    This app, “Graphs: How Do You Do This In SAS?”, is one of a series of eBooks about SAS software programming focusing on frequently asked questions and answers about classic SAS/GRAPH and the new ODS Graphics, illustrated by code samples which can be sent by email directly from the app. The series of ebooks has been designed to encourage users to contribute questions some of which will be included in future versions of the app.

    Add to basket
    Quick View
  • Practical ODS Graphics course notes (ePUB)

    £22.50

    This ePUB ebook is a copy of the course notes used with the Practical ODS Graphics course listed in the list of Training Courses provided by Holland Numerics Ltd. All code included in the ePUB ebook can be copied and pasted into SAS to try it out yourself.

    Practical ODS Graphics course notes (ePUB)

    £22.50

    This ePUB ebook is a copy of the course notes used with the Practical ODS Graphics course listed in the list of Training Courses provided by Holland Numerics Ltd. All code included in the ePUB ebook can be copied and pasted into SAS to try it out yourself.

    Add to basket
    Quick View
  • ODS Graph Templates course notes (ePUB)

    £22.50

    This ePUB ebook is a copy of the course notes used with the ODS Graph Templates course listed in the list of Training Courses provided by Holland Numerics Ltd. All code included in the ePUB ebook can be copied and pasted into SAS to try it out yourself.

    ODS Graph Templates course notes (ePUB)

    £22.50

    This ePUB ebook is a copy of the course notes used with the ODS Graph Templates course listed in the list of Training Courses provided by Holland Numerics Ltd. All code included in the ePUB ebook can be copied and pasted into SAS to try it out yourself.

    Add to basket
    Quick View
  • Practical ODS Graphics course notes

    This PDF ebook is a copy of the course notes used with the Practical ODS Graphics course listed in the list of Training Courses provided by Holland Numerics Ltd. All code included in the PDF ebook can be copied and pasted into SAS to try it out yourself.

    Practical ODS Graphics course notes

    This PDF ebook is a copy of the course notes used with the Practical ODS Graphics course listed in the list of Training Courses provided by Holland Numerics Ltd. All code included in the PDF ebook can be copied and pasted into SAS to try it out yourself.

    Buy product
    Quick View
  • ODS Graph Templates course notes

    This PDF ebook is a copy of the course notes used with the ODS Graph Templates course listed in the list of Training Courses provided by Holland Numerics Ltd. All code included in the PDF ebook can be copied and pasted into SAS to try it out yourself.

    ODS Graph Templates course notes

    This PDF ebook is a copy of the course notes used with the ODS Graph Templates course listed in the list of Training Courses provided by Holland Numerics Ltd. All code included in the PDF ebook can be copied and pasted into SAS to try it out yourself.

    Buy product
    Quick View
  • eBook: Power User’s Guide to SAS Graph Templates (PDF)

    £3.00

    Visualising data is a vital part of data analysis and reporting. This ebook introduces Graph Templates, which have been included in the SAS System since version 9.1.3. In particular, the automatic creation of Graph Templates is described, so anyone can create standardised, reusable and platform-independent graphs. Code samples are provided throughout this ebook, so you can learn about Graph Templates by following these examples.

    eBook: Power User’s Guide to SAS Graph Templates (PDF)

    £3.00

    Visualising data is a vital part of data analysis and reporting. This ebook introduces Graph Templates, which have been included in the SAS System since version 9.1.3. In particular, the automatic creation of Graph Templates is described, so anyone can create standardised, reusable and platform-independent graphs. Code samples are provided throughout this ebook, so you can learn about Graph Templates by following these examples.

    Add to basket
    Quick View
  • SAS Programming and Data Visualization Techniques (Amazon.co.uk)

    SAS Programming and Data Visualization Techniques: A Power User’s Guide brings together a wealth of ideas about strategic and tactical solutions to everyday situations experienced when transferring, extracting, processing, analyzing, and reporting data. Most of the solutions can be achieved using the SAS components you already license, eliminating the need to throw money at the problems.

    SAS Programming and Data Visualization Techniques (Amazon.co.uk)

    SAS Programming and Data Visualization Techniques: A Power User’s Guide brings together a wealth of ideas about strategic and tactical solutions to everyday situations experienced when transferring, extracting, processing, analyzing, and reporting data. Most of the solutions can be achieved using the SAS components you already license, eliminating the need to throw money at the problems.

    Buy product
    Quick View
  • SAS Programming and Data Visualization Techniques (Barnes and Noble)

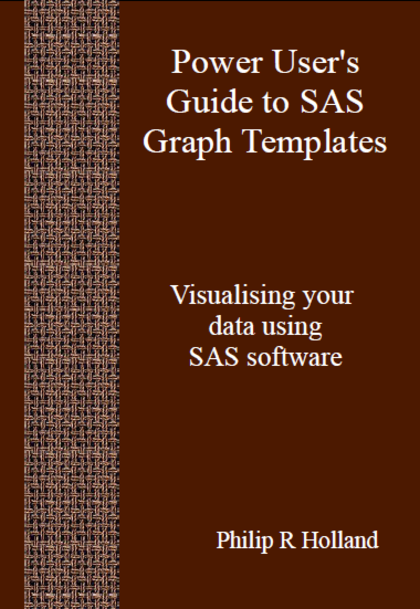
    SAS Programming and Data Visualization Techniques: A Power User’s Guide brings together a wealth of ideas about strategic and tactical solutions to everyday situations experienced when transferring, extracting, processing, analyzing, and reporting data. Most of the solutions can be achieved using the SAS components you already license, eliminating the need to throw money at the problems.
    SAS Programming and Data Visualization Techniques (Barnes and Noble)

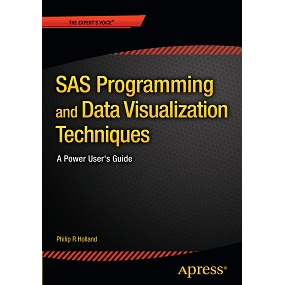
    SAS Programming and Data Visualization Techniques: A Power User’s Guide brings together a wealth of ideas about strategic and tactical solutions to everyday situations experienced when transferring, extracting, processing, analyzing, and reporting data. Most of the solutions can be achieved using the SAS components you already license, eliminating the need to throw money at the problems.
    Buy product
    Quick View
  • Graphs: How Do You Do This in SAS? (Amazon Appstore)

    This app, “Graphs: How Do You Do This In SAS?”, is one of a series of eBooks about SAS software programming focusing on frequently asked questions and answers about classic SAS/GRAPH and the new ODS Graphics, illustrated by code samples which can be sent by email directly from the app. The series of ebooks has been designed to encourage users to contribute questions some of which will be included in future versions of the app.

    Graphs: How Do You Do This in SAS? (Amazon Appstore)

    This app, “Graphs: How Do You Do This In SAS?”, is one of a series of eBooks about SAS software programming focusing on frequently asked questions and answers about classic SAS/GRAPH and the new ODS Graphics, illustrated by code samples which can be sent by email directly from the app. The series of ebooks has been designed to encourage users to contribute questions some of which will be included in future versions of the app.

    Buy product
    Quick View
  • SAS Programming and Data Visualization Techniques (Amazon.com)

    SAS Programming and Data Visualization Techniques: A Power User’s Guide brings together a wealth of ideas about strategic and tactical solutions to everyday situations experienced when transferring, extracting, processing, analyzing, and reporting data. Most of the solutions can be achieved using the SAS components you already license, eliminating the need to throw money at the problems.

    SAS Programming and Data Visualization Techniques (Amazon.com)

    SAS Programming and Data Visualization Techniques: A Power User’s Guide brings together a wealth of ideas about strategic and tactical solutions to everyday situations experienced when transferring, extracting, processing, analyzing, and reporting data. Most of the solutions can be achieved using the SAS components you already license, eliminating the need to throw money at the problems.

    Buy product
    Quick View
  • SAS Programming and Data Visualization Techniques (Apress)

    SAS Programming and Data Visualization Techniques: A Power User’s Guide brings together a wealth of ideas about strategic and tactical solutions to everyday situations experienced when transferring, extracting, processing, analyzing, and reporting data. Most of the solutions can be achieved using the SAS components you already license, eliminating the need to throw money at the problems.

    SAS Programming and Data Visualization Techniques (Apress)

    SAS Programming and Data Visualization Techniques: A Power User’s Guide brings together a wealth of ideas about strategic and tactical solutions to everyday situations experienced when transferring, extracting, processing, analyzing, and reporting data. Most of the solutions can be achieved using the SAS components you already license, eliminating the need to throw money at the problems.

    Buy product
    Quick View