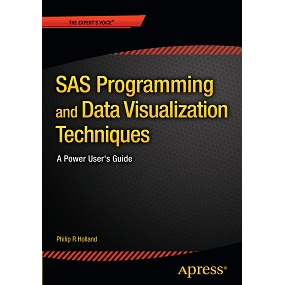
Description
![]()
Abstract
This paper will use the specific examples of split axis line plots and charts to explain how to approach the development of ODS Templates for standard and non-standard graphs in SAS 9.2.
- SAS Global Forum, Seattle, WA, USA – 12th April 2010
- PhUSE, Berlin, Germany – 20th October 2010 (Best Presentation in Coding Solutions)
- PhUSE Single Day Event, Brussels, Belgium – 28th April 2011
- PhUSE Single Day Event, Frankfurt, Germany – 4th May 2011
- PhUSE Single Day Event, Uxbridge, UK – 6th June 2011


Reviews
There are no reviews yet.