Description
![]()
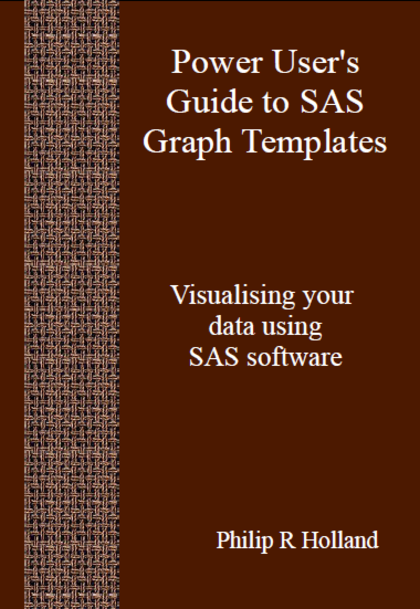
Visualising data is a vital part of data analysis and reporting. This ebook introduces Graph Templates, which have been included in the SAS System since version 9.1.3. In particular, the automatic creation of Graph Templates is described, so anyone can create standardised, reusable and platform-independent graphs. Code samples are provided throughout this ebook, so you can learn about Graph Templates by following these examples.
Philip R Holland advises a broad range of clients throughout Europe and the United States as an independent consultant and founder of Holland Numerics Ltd, a SAS technical consultancy. A SAS user since 1981, he has worked on all the major computing platforms that support SAS software, and he frequently speaks on a wide range of topics related to SAS at conferences around the globe.
He is the editor of VIEWS News, the quarterly journal of the VIEWS International SAS Programming Community, and has been a VIEWS committee member since 2002. He is a SAS Certified Advanced Programmer, a member of the British Computer Society, and a Chartered Information Technology Practitioner.
[This ebook was officially retired in August 2015, then un-retired in February 2018]


Reviews
There are no reviews yet.