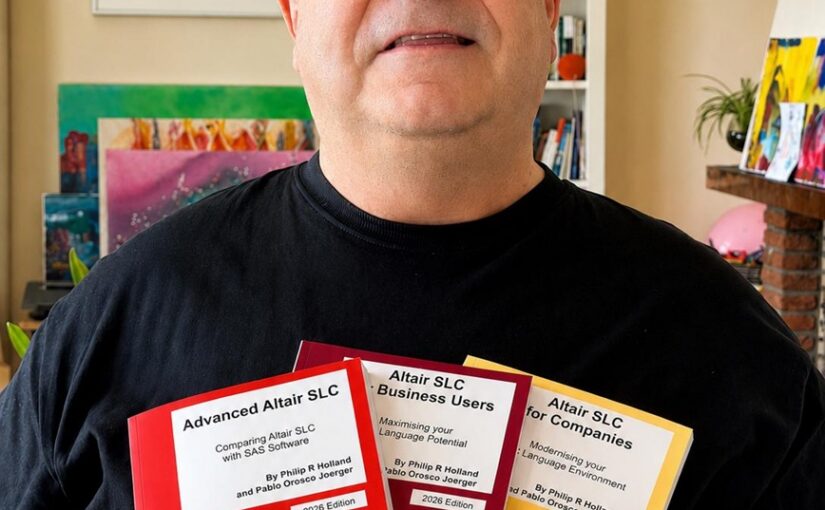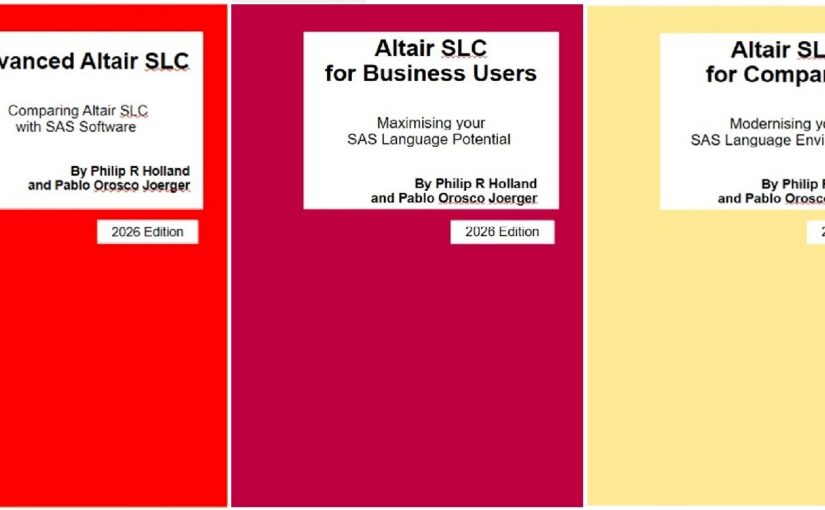

Twenty-four ready-to-post items promoting the three Altair SLC books, eight for each. No topic appears twice. Where a subject is covered by more than one book it has been assigned to the book that treats it most fully, so the three sets could be scheduled in any order without repeating any information.
The three books at a glance
| Book | Pages | Audience to aim the posts at |
|---|---|---|
| Book A – Advanced Altair SLC: Comparing Altair SLC with SAS Software | 210 | Experienced SAS programmers. Technical detail earns the engagement here; lead with the specific. |
| Book B – Altair SLC for Business Users | 207 | Programmers and analysts doing the daily work. Practical, problem-and-answer posts. |
| Book C – Altair SLC for Companies | 142 | Managers, architects and procurement. Cost, risk and migration; keep these the shortest. |
All three are by Philip R Holland and Pablo Orosco Joerger, 2026 edition, first printing, July 2026:
Each post will include the purchasing links above, but also a link back to this post to explain the target audiences.