COVID-19 SAS Studio Project No.2: Visualising global trends in Johns Hopkins University data

Loading

This is a project to read the daily Johns Hopkins COVID-19 data and visualise the national infection and fatality trends using Base SAS and SAS/STAT:

  1. Download the GitHub Desktop software from https://desktop.github.com/ and install it on your computer where you will be running SAS Studio or SAS University Edition. For instructions on how to install SAS University Edition on your own computer please read my blog post “Are you learning about SAS?”.
  2. Clone the Johns Hopkins COVID-19 data at https://github.com/CSSEGISandData/COVID-19, and then Pull the latest data, using the GitHub Desktop. This will reduce the time need to download all of the latest data each time you run the SAS Studio project, as a simple and quick Pull request in GitHub Desktop is all that is required each time.
  3. Download my SAS Studio CPF project file (John-Hopkins-GitHub-data.cpf), which is a zipped CPF file and will be updated occasionally with accepted submitted updates. Please check for comments here when updates are added.
  4. Open the CPF project file in SAS Studio (requires Base SAS and SAS/STAT) or SAS University Edition (making certain you have created a Shared Folder(s) first that are pointing to where your GitHub files and CPF project file are stored).
  5. Update the “run first” program to include your GitHub file folder in the &_dir macro variable assignment. The CSV files we will be using can be found in the /csse_covid_19_data/csse_covid_19_daily_reports folder.
  6. Submit each program in order given below (or submit all of the programs in the project’s flow together):
    • (1) “run first” assigns the location of the data to the &_dir macro variable.
    • (2) “Read CSV files” creates the SAS data sets in WORK by reading all of the CSV files in the csse_covid_19_daily_reports folder. Summarise the records by Country_Region to remove finer detail in the csse_covid_19_daily_reports.
    • (3) “Calculate regression lines” generates the regression lines for confirmed cases between 100 and 10,000, and deaths between 10 and 1,000, to include on the graphs. The regression lines appear to be straight in the semi-log plots, but are actually exponential to match the initial growth of confirmed cases, so that “flattening” of the curves can be identified more easily.
    • (4) “Semi-log plots of confirmed vs deaths” generates the graphs for countries where COVID-19 has had more than 1,000 confirmed cases or more than 100 deaths.

Some questions for you to answer:

    • (a) Where could my “Read CSV files” program be improved?
    • (b) Why is the US graph split at around 20Mar2020? Is this a problem with the data or my program?
    • (c) Are all of cases being included?

This project is open to SAS programmers and to researchers. Follow the above instructions yourself, and then see if you can improve my SAS code by answering the questions.

Please send your saved SAS Studio flow containing your improved versions of the SAS programs to phil@hollandnumerics.org.uk. Anyone providing improvements that can be incorporated will be added to the credits for this project.

My first COVID-19 SAS project for SAS Studio/SAS University Edition can be found at “Can you help? Supporting Coronavirus Research by searching research papers with SAS“.

If you are still looking for SAS training, then please go to my blog post “SAS training for home-workers: Keeping your mind active and your skills current” for some more training options.

COVID-19 can be defeated, and, working together, we can make a difference!

Statisticians: Beware of the Datasaurus!!

Loading

Alberto Cairo created the Datasaurus Dozen to demonstrate the necessity to view data beyond its statistics. He created a scatterplot of a dinosaur, and then generated 12 very different scatterplots with almost identical statistics.

Plot of Datasaurus data set

  • N: 142
  • Mean: X=54.27, Y=47.83
  • Standard deviation: X=16.77, Y=26.94
  • Correlation x-y: -0.06

The 12 data sets with almost identical statistics to those above are plotted here, including the x and y means as reference lines:

More information about the Datasaurus Dozen, including how the Dozen were generated and how to download the data, can be found here.

The program to create these graphs, including the data, can be downloaded as a zip file from here.

I’m presenting at the Toronto SAS Meetup on 05Mar2019, but I won’t be there!

Loading

I’m presenting at the Toronto SAS Meetup on 27Feb2019 05Mar2019, but I won’t be there, because, technology permitting, I’ll be presenting remotely from my nice warm office in the UK. This is intended to take advantage of remote communications and to avoid the need for me to fly over the Atlantic for a 20-minute talk!

More information, including registration details, can be found at the Toronto SAS Meetup site.

Toronto SAS Meetup
I’ll be presenting “Converting Plots from SAS/GRAPH to ODS Graphics”. Please come to the meeting and ask me questions, as I’ll be happy to discuss any of the points in my presentation with you.

If you enjoy this presentation, then talk to Mamadou Dakouo about inviting me to present again at a future meeting, as this is the first of 4 different presentations about ODS Graphics.

Would you like 1/2 day or 1 day SAS training at PharmaSUG China 2020?

Loading

I was considering attending PharmaSUG China at the end of August 2019, but I’ve been told that a seminar held previously in China on SAS programming efficiency had a low attendance, as programmers there are relatively young, so they like to learn techniques on their own, or take classes on topics that they cannot learn from the internet. However, they prefer challenging topics, which are hard to learn on their own.

I have now decided to delay what could be my one and only visit to China until 2020, and use the extra preparation time to find out a little more about what SAS programmers in China would be most interested in.

Therefore, please could you help me by answering this quick poll about the 1/2 day training sessions I currently provide. The answers will guide me to the best package to offer to PharmaSUG China 2020. Links to most of the training courses can be found below the poll.

If you have not yet voted and can view the poll results, but the Vote button is grey, your IP address may already have been used to vote on this poll. This is in fact quite common when viewing blog posts from a company PC, so I would therefore recommend that you try voting using your phone or your home PC instead.

Thank you in advance………..Phil

I'm planning to go to PharmaSUG China in 2020. Which 1/2 day training courses would you be interested in attending there? (max 2)

  • Efficient SAS Programming (28%, 7 Votes)
  • Defensive SAS Programming (24%, 6 Votes)
  • Introduction to ODS Graph Templates (20%, 5 Votes)
  • SAS PROC SQL (12%, 3 Votes)
  • Enterprise Guide and SAS Studio (8%, 2 Votes)
  • Practical ODS Graphics (8%, 2 Votes)

Total Voters: 14

Loading ... Loading ...

STOP PRESS! I’m presenting on SAS Studio and ODS Graphics at the London SUGUKI on 10Jan2019. Attend the meeting for a chance to win an ebook in the draw!

Loading

STOP PRESS!

I’m presenting on SAS Studio and ODS Graphics at the London SUGUKI Meetup on 10Jan2019.

Attend the meeting for a chance to win an ebook in the draw! Note that you meet register at http://www.meetup.com/SUGUKI to be allowed into the meetup, where you can find more details about this and other SUGUKI events.

Hope to meet you there…………Phil

Have I told you about who won the Prize Draw at the October SUGUKI meeting in London?

Loading

Practical ODS Graphics Course notes

Have I told you about who won the Prize Draw at the October SUGUKI meeting in London? I don’t think I have, so I’d better rectify this omission and tell you that Richie McKern won a copy of the my Practical ODS Graphics Course notes as an ebook on a USB key in the Prize Draw, along with a load of other SAS-related papers.

My presentation on Annotate and ODS Graphics was well-received by a small band of SAS enthusiasts. I’ve not heard when I’ll next be presenting at a SUGUKI meeting, but I can tell you that my next presentation will be “Using SAS Studio Tasks to Plot with ODS Graphics”.

Looking forward to seeing you there, whenever it is.

See you in London for the SAS Users (SUGUKI) Meetup on October 4th

Loading

Practical ODS Graphics Course NotesSee you in London for the SAS Users (SUGUKI) Meetup on October 4th.

I’ll be presenting on Annotate and ODS Graphics, but you must register to be able to attend. More details can be found at https://www.linkedin.com/feed/update/urn:li:activity:6452528018387800065

SUGUKI SAS user group in the UK & Ireland – September & October updates

Loading

SUGUKI is an independent SAS User Group, staffed by volunteers – and we are in continuous need of speakers, venues, sponsorship, and general support. Our web site can be found at https://www.meetup.com/SUGUKI. We’d love to hear from you. We also now have a community on SAS Communities!!

Our events are always 6-8pm on a Thursday, with two SAS presentations and drinks. Sign up below!

06SEP2018 – London SUGUKI meetup – https://www.meetup.com/SUGUKI/events/bvxtjpyxmbjb/ – Come and see David Shannon (Amadeus) present “Come on, Baby, Light My SAS Viya”.
20SEP2018 – Manchester SUGUKI meetup – https://www.meetup.com/SUGUKI/events/253408203/
04OCT2018 – London SUGUKI meetup – https://www.meetup.com/SUGUKI/events/bvxtjpyxnbgb/ – I’ll be presenting “Converting Annotate to ODS Graphics. Is it possible?” and offering copies of some of my latest ebooks in a free prize draw for attendees!

All these events are free, but you must register for security and capacity reasons.

The winner of the Book Draw at the SUGUKI April18 meeting in London is … Chris Smith!

Loading

The winner of the Book Draw at the SUGUKI April18 meeting in London was Chris Smith!
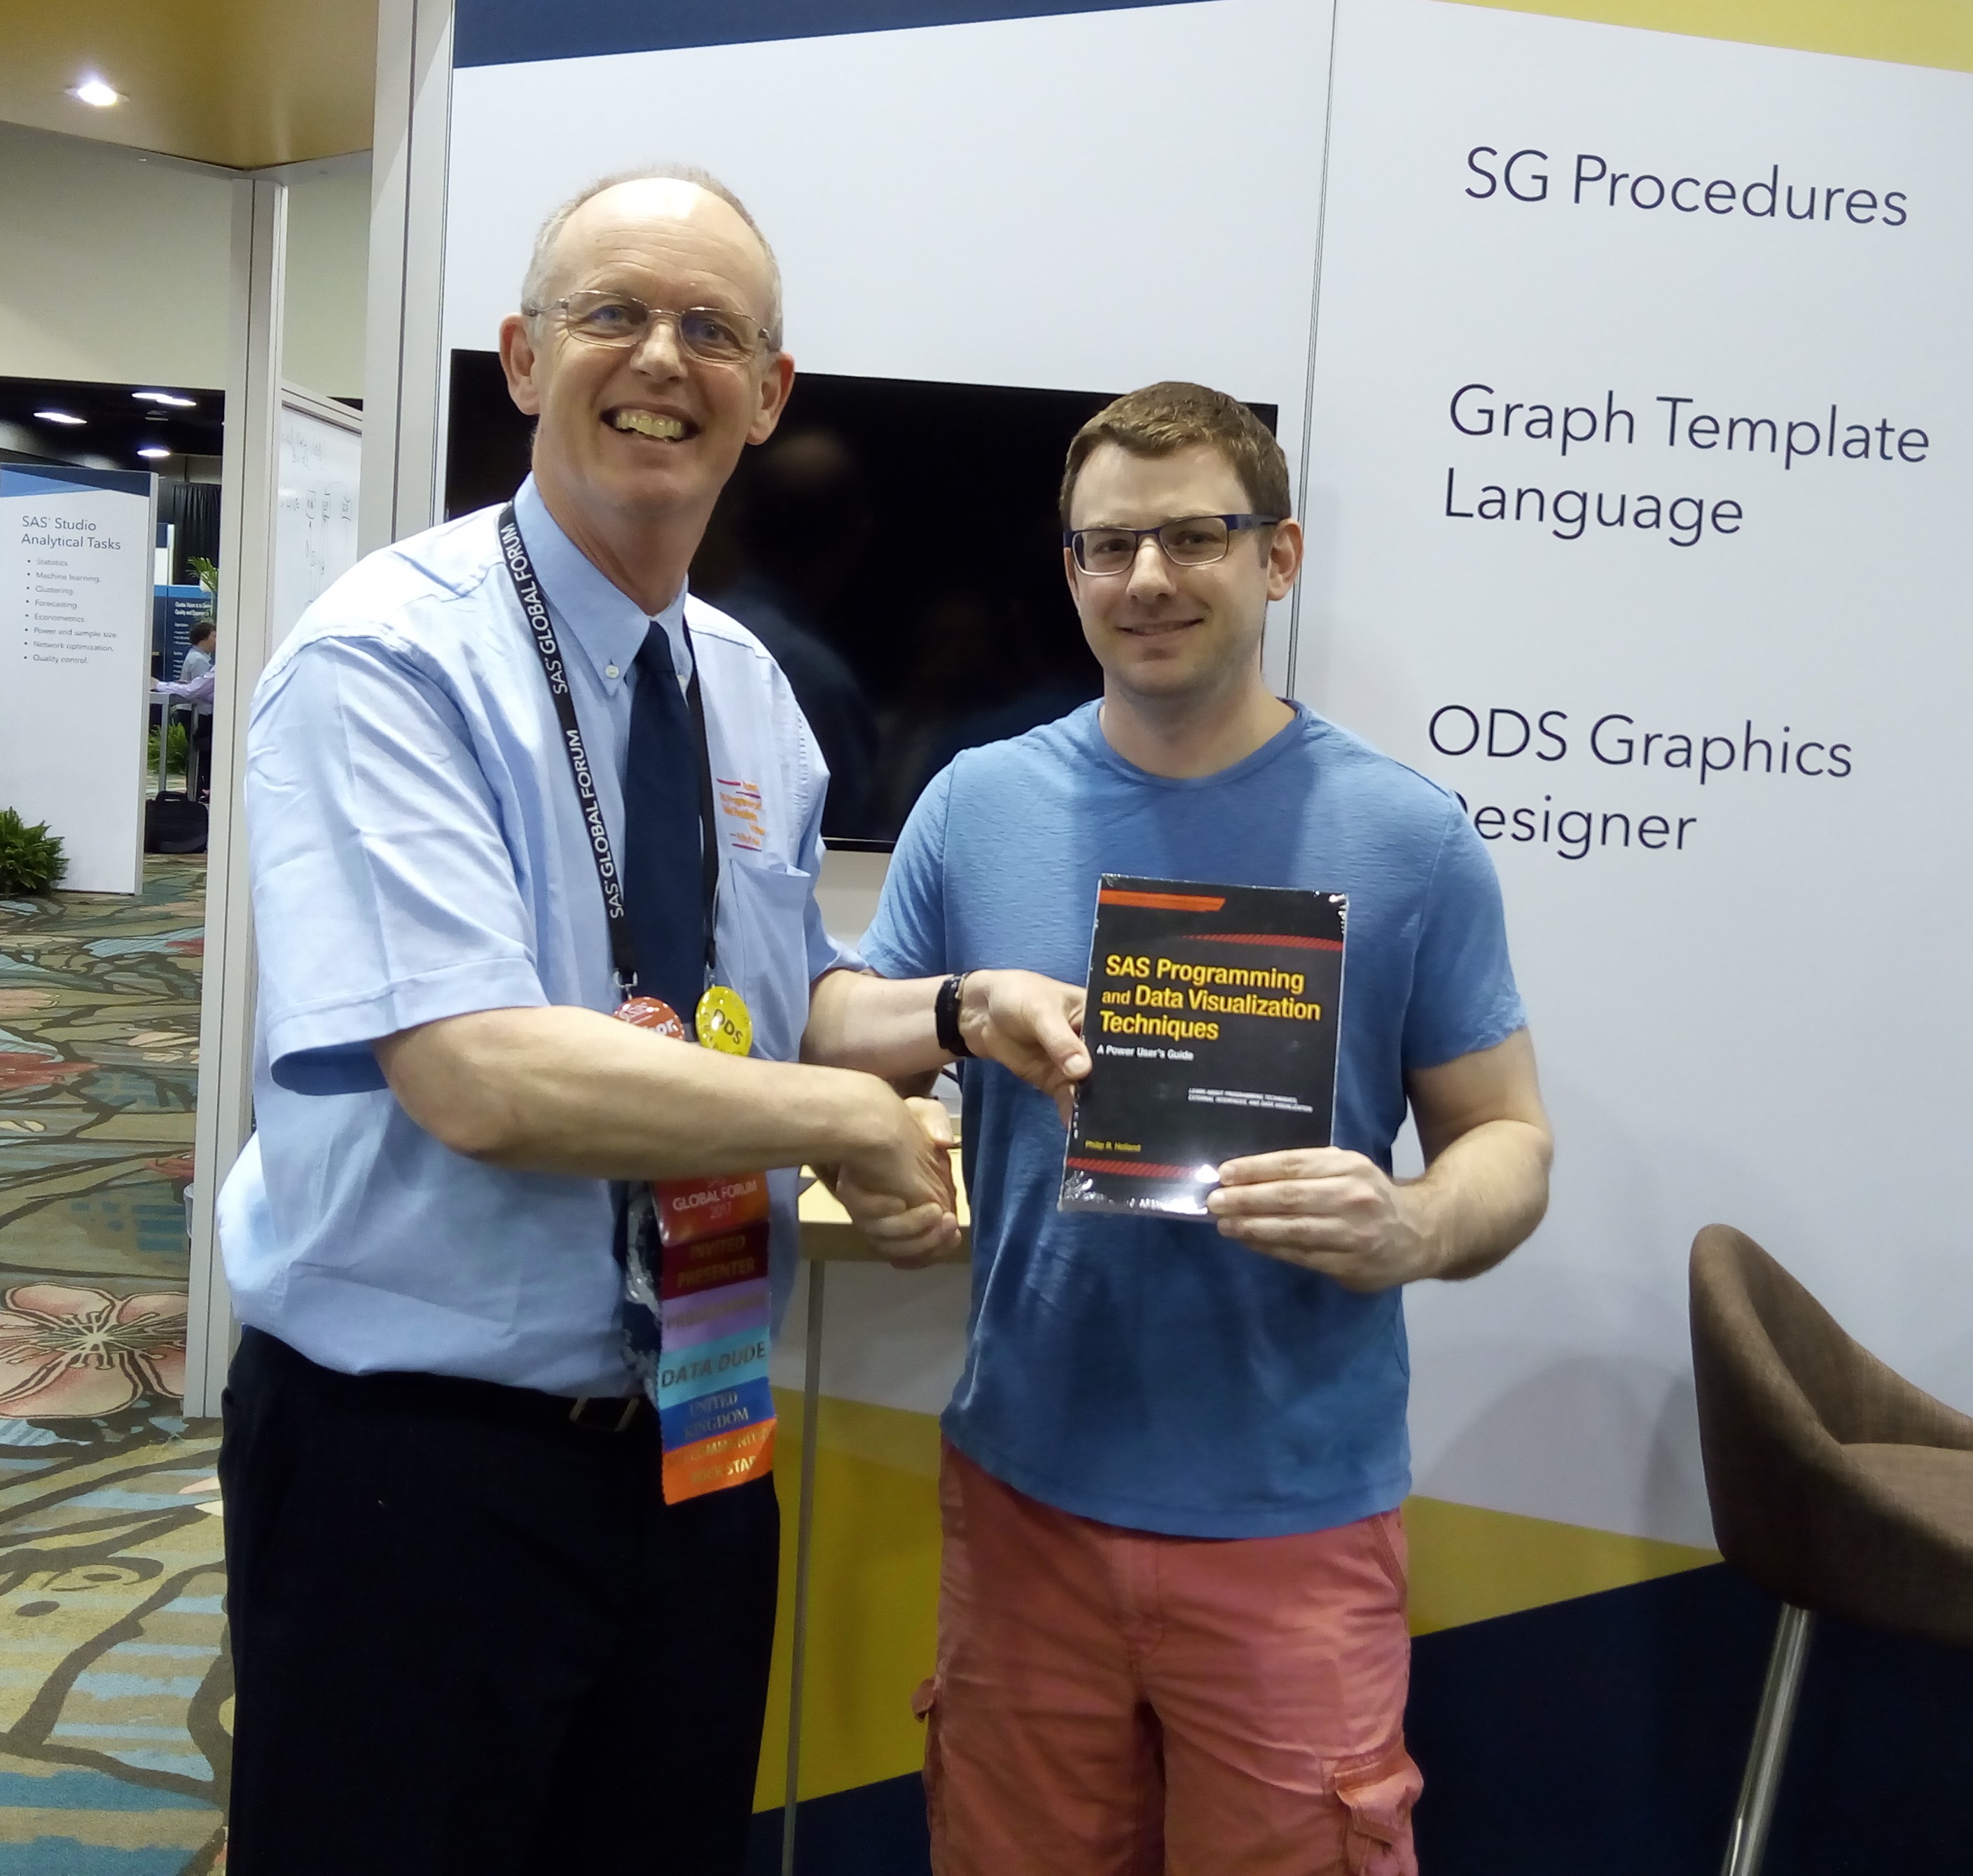
The meeting in SAS UK’s London offices was a great success. Hadley Christoffels presented on data management in the cloud after I’d presented my “Converting Plots from SAS/GRAPH to ODS Graphics” paper to a lively and appreciative audience.

A SUGUKI meeting in Edinburgh will be held on 19 April, before we return to SAS UK’s offices in London for the May meeting on 3 May. I’ll be presenting again at the July meeting, but you can find all the details about the SUGUKI meetings on their web site.

Poll: How does your company create graphs?

Loading

ODS Graphics has been around since SAS 9.1.3 (in 2006!), and yet it hasn’t yet taken over the SAS graphics world, even though it could create the vast majority of graphs.

With this in mind I thought I’d create a quick poll to see what is currently being used out there in the real world:

How does your company create graphs?

View Results

Loading ... Loading ...

If you think your company ought to be using ODS Graphics more, then download our SAS training course list for free.

If you would like to learn about ODS Graphics yourself, even if your company doesn’t want to pay for a training course for you and your colleagues, then you should read “Part III: Data Visualization” (chapters 9-14) in my book “SAS Programming and Data Visualization Techniques: A Power User’s Guide” instead.

Are you going to SAS Forum UK 2017 in Birmingham? I’m presenting there!

Loading

SAS Forum UK 2017 is being held in the Vox Conference Centre near the Birmingham NEC again this year from Tuesday 26th to Wednesday 27th September 2017, and I’ll be presenting “Making Graphs Easier to Validate – The Benefits of ODS Graphics” at 1130hr in the Tech Tips stream on the Tuesday.

It will not a very big conference (although last year there were 650 attendees spread over the 2 days), as not everyone attends both days, but it will lean heavily towards techie topics again. Those looking to take certification exams will be able to do so during Tuesday, Tuesday also includes streams for “Expert services for: Learning & Academia”, “Expert services for: Consulting & Premium Support”, “Tech Tips” and “Super Demos”, and the Wednesday will include streams for “Customer Stories”, “SAS Presents”, “Technical Insights” and more “Super Demos”. See the SAS Forum UK 2017 web site for more details.

I will be running a prize draw again for you to win a copy of my recent book “SAS Programming and Data Visualization Techniques: A Power User’s Guide”. Just drop in a business card or fill out a blank card at the stand to get a chance to win a copy.

Hope to see you there.

What happened in Orlando?

Loading

As usual I ran a prize draw this year at SAS Global Forum in Orlando for a copy of my latest book, which was won by Matthew Hoolsema from Carnegie Mellon University from 49 draw entries.

Matthew Hoolsema won a copy of my book in Orlando

The sad part was that my well-thumbed sample copy, which allowed everyone to see what was in the book, was taken during the conference, so I will have to replace it with another brand new copy before my next free draw, instead of using that new copy as a prize. I must admit that I find it extremely annoying when a company can pay $100s to $1,000s for the conference registration, travel and accommodation, but nothing for a $40 book!

The conference’s Kick-Back party was held at Disney Hollywood Studios at the end of the 2nd full day of the conference after the public had left. I’d last visited this park in 1999, when it was called MGM Studios. Some of the “exciting” rides, which I have never enjoyed, were open, and my favourite show from 1999, “Indiana Jones Stunt Spectacular”, was still there, but disappointingly closed for the evening! Fortunately, unlike previous Kick-Back parties, the noise levels were low enough to permit normal conversations, so my voice was still OK the following morning for my presentation. You may remember that in March I said that I was presenting “Making Validation of Graphs Easier: The Benefits of ODS Graphics” at the conference on 5 April 2017. The video recording of my presentation can now be viewed on the SAS web site, along with several of the other presentations, and my paper, slides and sample code can be downloaded from this blog site.

Next year SAS Global Forum will be in Denver, Colorado. I’ve never been there before, so I’m looking for some suitable topics for new presentations. Any suggestions?